The 2.9.0 release of the Platform drops this week, and with it comes GOV.UK charts enhanced tables.
This integrates some work done by the GOV.UK team with the Platform's content editor, allowing you to enhance tables so they appear as bar charts in the front end of the site. Some screenshots usefully illustrate this:
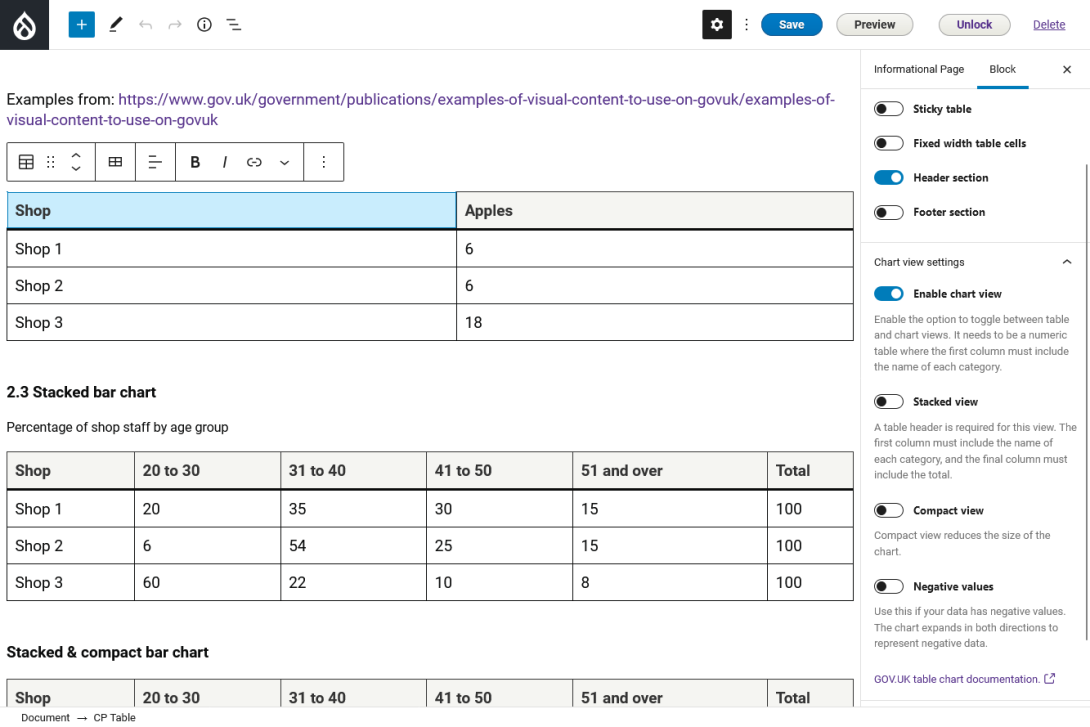
To enhance a table, it's just a case of toggling on the "Enable chart view" option in the content editor.
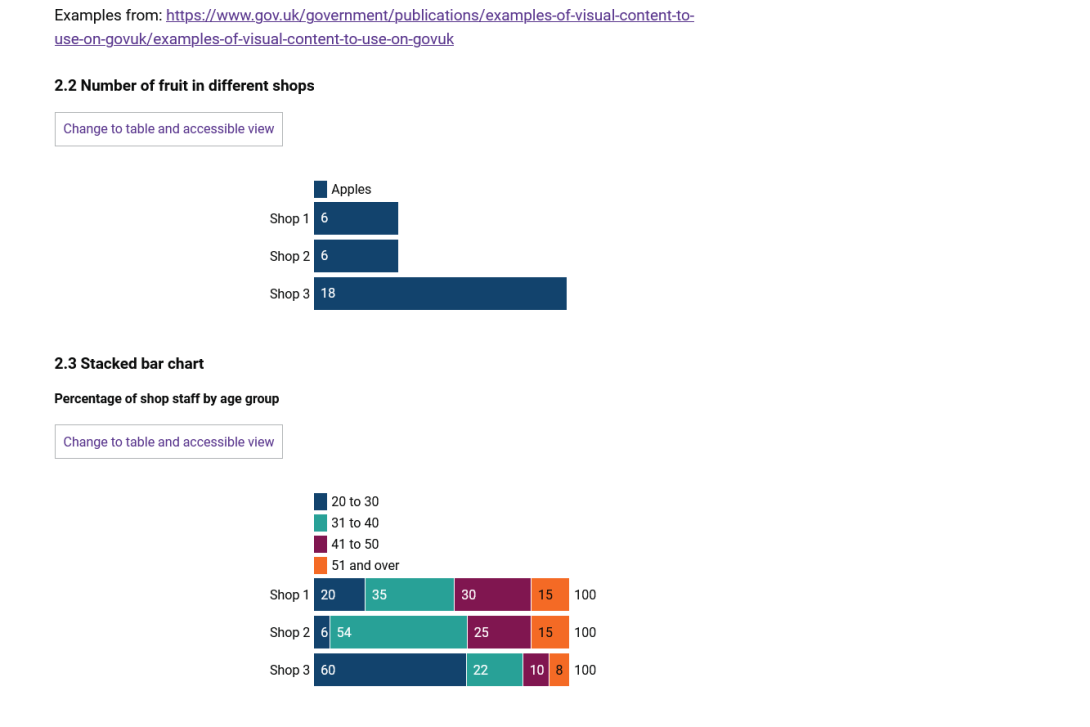
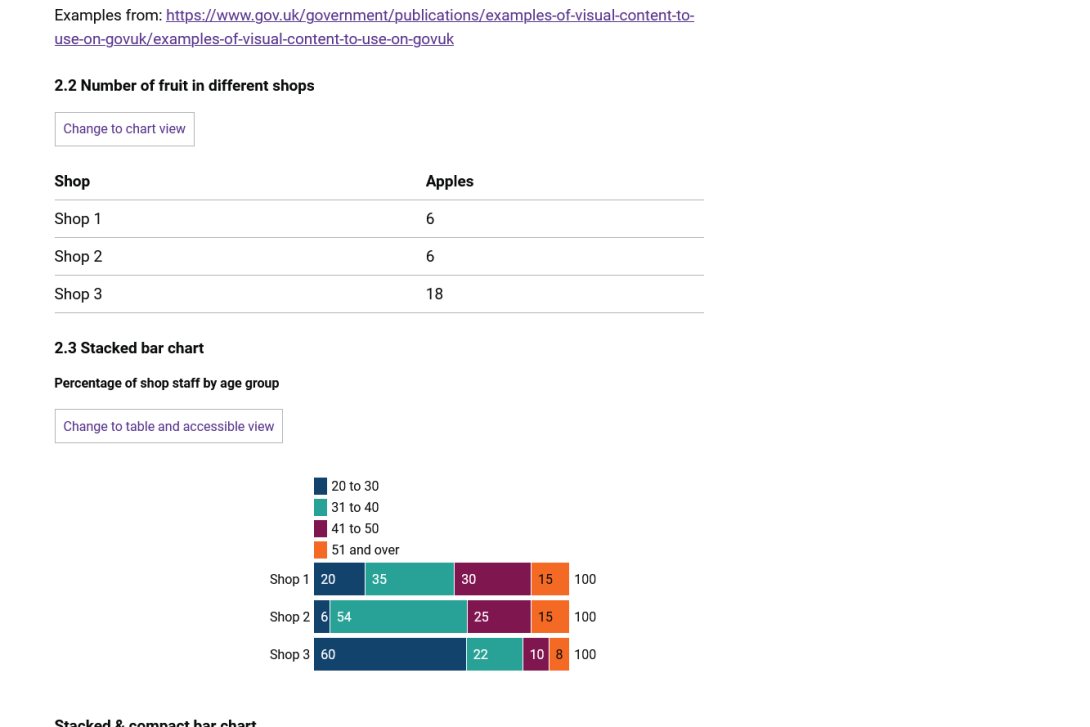
The table will then render as a chart in the frontend of the site. There is a toggle for users to switch back to table view.
We've supported the various style options implemented by the GOV.UK team:
- Stacked.
- Compact.
- Negative values.
These marry up to the examples at https://www.gov.uk/government/publications/examples-of-visual-content-t….
This enhancement was commissioned by Plymouth City Council, using the support time available to them as part of their subscription. The functionality will be available free of charge for all existing subscribers.